

How to Automate IT Operations and Incident Response Using Multi-Agent AI Systems
$150.00
| System Name: |
Agentic IT Operations Center (AIOps) |
|---|---|
| Architecture: |
Hierarchical Multi-Agent System – 1 IT Operations Orchestrator (Coordinator) + 7 specialized Worker Agents (Observability; Anomaly; Root Cause; Remediation; Change Risk; Capacity; Incident) operating through continuous real-time signal processing; event-driven inter-agent topology correlation; shared IT operations vector knowledge base; and human-in-the-loop approval gates for production system changes and P1/P2 incident decisions; 8 total agents |
| Coordinator Agent: |
IT Operations Orchestrator – continuously receives signal events from all 7 Worker Agents; correlates anomaly signals; root cause findings; and incident events across the full IT topology; decomposes the current operational goal (prevent outage; restore service; optimize capacity; assess change risk) into sub-tasks per Worker Agent; enforces the incident management workflow (Anomaly Agent detects before Root Cause Agent investigates before Remediation Agent acts); and routes P1/P2 incidents and high-risk production changes to the SRE Lead or VP Infrastructure for human approval |
| Extensibility Note: |
Beyond the 9 native Goldfinch AI tools; users can add custom tools self-service – including APM platform connectors (New Relic; AppDynamics); network monitoring platforms (SolarWinds; Cisco ThousandEyes); security information and event management (SIEM) platforms (Splunk; IBM QRadar); cost optimization platforms (CloudHealth; Apptio); and custom runbook automation platforms. |
| On-Premise Supported: |
Yes – eZintegrations connects to on-premises systems (ServiceNow on-prem; Dynatrace managed on-prem; on-premises monitoring infrastructure; on-premises CMDB; and others) via IPSec Tunnel. eZintegrations is a browser-based; cloud-hosted platform and does not require any on-premises installation. |
| Tags: |
Goldfinch AI AIOps platform; AIOps AI orchestration; multi-agent IT operations; ServiceNow AI agent; autonomous remediation AI; incident management AI; Dynatrace AI agent; MTTR reduction AI; alert noise reduction AI; change risk assessment AI; capacity planning AI agent; Goldfinch AI SRE |
| AI Credits Required: |
Yes – Goldfinch AI agentic systems consume credits across all 8 agents per monitoring cycle, per anomaly detected and analyzed, per incident processed, and per reflection/retry loop. |
| Safety Layer: |
Change Risk Agent scores a planned change as High or Critical risk – Change Advisory Board review required before the change proceeds; Root Cause Agent confidence falls below 0.75 on any RCA finding – SRE Lead review required before Remediation Agent acts on the proposed fix. Max 3 retries for Remediation Agent before SRE Lead escalation with full incident context. All HITL decisions logged with reviewer identity, action authorized, and timestamp for ITSM audit trail and change governance documentation., Human-in-the-loop gate triggers when: Remediation Agent identifies a required action outside the configured autonomous authority scope (production database restart, Kubernetes namespace deletion, cloud infrastructure termination above configured resource threshold) – SRE Lead approval required before execution; Incident Agent classifies a P1 incident affecting revenue-generating production systems – VP Infrastructure or CIO notification required within 5 minutes of P1 declaration; |
| Worker Agents: |
Anomaly Agent: Applies ML-based anomaly detection to the normalized telemetry stream – detecting statistical deviations in latency, error rate, throughput, resource utilization, and application response time that indicate an emerging performance degradation before it becomes a user-impacting outage, and publishing anomaly events to the Orchestrator within minutes of signal deviation; Root Cause Agent: Performs topology-aware root cause analysis when the Anomaly Agent publishes an anomaly event – traversing the CMDB dependency graph to identify the causal chain from the anomalous signal to the root cause service, infrastructure component, or configuration change that triggered the degradation, Capacity Agent: Forecasts infrastructure capacity requirements 30, 60, and 90 days ahead using historical utilization trends and business demand signals – identifying services approaching capacity thresholds, recommending proactive scaling actions (cloud auto-scaling policy adjustments, reserved capacity purchases), and preventing capacity-triggered outages before they occur; Incident Agent: Manages P1 and P2 incidents end-to-end – creating the ServiceNow incident record, coordinating the incident bridge (identifying and notifying the correct resolver groups based on the Root Cause Agent’s topology analysis), tracking incident timeline, publishing stakeholder communications at configured intervals, and executing the post-incident review documentation, Observability Agent: Continuously aggregates logs, metrics, and distributed traces from all configured systems – cloud infrastructure (AWS, Azure, GCP), Kubernetes clusters, application performance monitoring (Dynatrace or Datadog), database performance, network telemetry, and synthetic monitoring – publishing normalized, correlated telemetry events to the shared IT operations Knowledge Base for all downstream agents, Remediation Agent: Executes automated remediation actions for approved remediation playbooks – including service restarts, pod scaling in Kubernetes, cache flush operations, connection pool resets, auto-scaling group adjustments in AWS or Azure, and configuration rollbacks – within the configured autonomous authority scope; routes actions outside the autonomous scope to the SRE Lead for approval; Change Risk Agent: Assesses the risk of planned infrastructure and application changes before they are implemented – evaluating the change’s impact on dependent services via CMDB topology analysis, comparing the change window against historical incident patterns, and scoring the change risk (Low/Medium/High/Critical) with a recommended approval path for the Change Advisory Board |
Table of Contents
| Planning: |
The IT Operations Orchestrator uses event-driven goal decomposition – when an anomaly event is detected; the Orchestrator decomposes the operational goal (restore service to SLA) into a sequenced sub-task chain (Anomaly Agent confirms severity; Root Cause Agent identifies causal chain; Remediation Agent executes fix; Incident Agent manages communication). Schema-driven rules govern the incident severity classification and remediation authorization tiers; LLM reasoning governs root cause topology analysis; change risk assessment; capacity forecast narrative; and post-incident review synthesis. |
|---|---|
| Messaging: |
All 8 agents communicate via structured operational event messages – the Anomaly Agent publishes a structured anomaly event (affected service; anomaly type; severity score; first-detected timestamp; affected metrics) that the Orchestrator validates against the incident threshold before activating the Root Cause Agent; the Root Cause Agent publishes the causal chain finding (root cause component; topology path; confidence score; recommended remediation action) that the Orchestrator uses to select the remediation playbook and route for HITL approval or autonomous execution. |
| Reflection: |
The Root Cause Agent applies a reflection cycle when the initial topology traversal produces a confidence score below 0.75 – re-querying the Knowledge Base for known failure patterns matching the current anomaly signature; expanding the CMDB topology scope to include 2nd-degree service dependencies; and retrying the causal chain analysis up to 3 times before escalating to the SRE Lead with the best available RCA context. The Remediation Agent applies a reflection check before executing any remediation action – confirming that the proposed action matches a runbook in the Knowledge Base and that no conflicting change or remediation is in progress for the same service. |
| Knowledge: |
All 8 agents share a persistent IT operations vector knowledge base containing: CMDB service topology and dependency maps (updated from ServiceNow CMDB in real time); known failure patterns and their causal signatures (failure mode library built from historical incident data); runbook procedures for all configured remediation actions per service tier and action type; change risk scoring rubrics and historical change-to-incident correlation data; capacity planning benchmarks and SLA thresholds per service; and post-incident review findings – each agent retrieves context specific to the current affected service; its dependency topology; and its known failure history. |
| Execution: |
The Observability Agent continuously aggregates telemetry via API Tool Call to the configured monitoring platforms. The Anomaly Agent runs ML anomaly detection via Data Analysis on the normalized telemetry stream continuously. The Root Cause Agent traverses the CMDB topology graph via API Tool Call when an anomaly is confirmed. The Remediation Agent executes approved remediation actions via API Tool Call to Kubernetes; AWS; and Azure APIs within configured authority limits. The Change Risk Agent evaluates each ServiceNow change request via API Tool Call and CMDB analysis before the change window. The Capacity Agent computes capacity forecasts weekly and on-demand via Data Analysis on Snowflake DW utilization data. The Incident Agent creates and manages ServiceNow incident records via Integration Workflow as Tool for all P1 and P2 incidents. |
| Business Impact: |
Gartner research: IT organizations receive an average of 2.1 million alerts per month from monitoring tools – of which less than 0.1% require immediate action; the signal-to-noise ratio consumes SRE team capacity that should be directed toward prevention; not triage. IDC research: the average cost of an unplanned IT outage is $250,000 per hour for enterprise organizations; 40% of outages are preventable through proactive capacity and anomaly management. The Goldfinch AI AIOps platform reduces alert noise by 80%; cuts MTTR from the industry average of 4.2 hours to under 74 minutes; and prevents 40% of outages through predictive capacity and anomaly management – converting a reactive IT operations function into a proactive; intelligence-driven operation. |
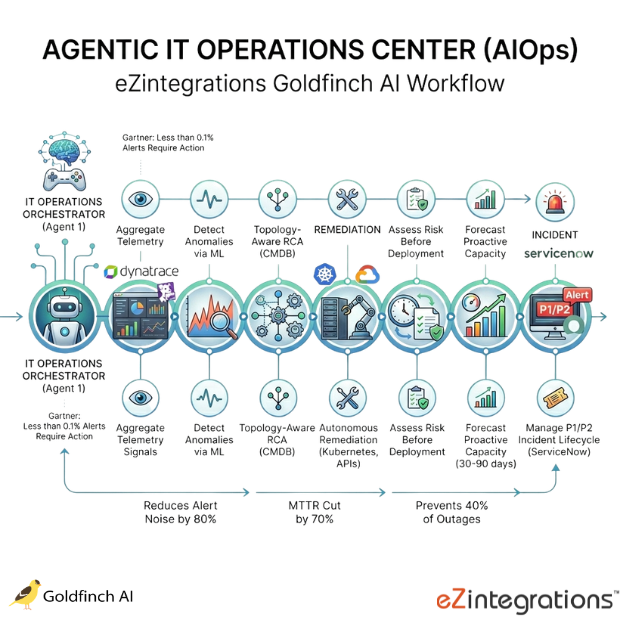
The Goldfinch AI AIOps platform from eZintegrations deploys 8 coordinated AI agents – an IT Operations Orchestrator plus 7 specialized Worker Agents – to continuously aggregate observability signals from Dynatrace or Datadog, detect anomalies via ML, perform topology-aware root cause analysis through the CMDB, execute autonomous remediation in Kubernetes and cloud APIs, assess change risk before production deployments, forecast capacity proactively, and manage P1/P2 incidents end-to-end in ServiceNow – reducing alert noise by 80%, MTTR by 70%, and preventing 40% of outages. eZintegrations is an enterprise automation platform covering iPaaS, AI Workflows, AI Agents, and Goldfinch AI agentic automation.
What Is Goldfinch AI AIOps Platform Automation?
Goldfinch AI AIOps platform automation is a hierarchical multi-agent system where an IT Operations Orchestrator receives telemetry signals from the Observability Agent, routes anomaly events through Root Cause and Remediation Agents in sequence, and simultaneously manages change risk through the Change Risk Agent, capacity forecasting through the Capacity Agent, and incident lifecycle through the Incident Agent. Unlike traditional monitoring tools that alert SREs to investigate and remediate manually, the Goldfinch AI AIOps platform autonomously executes the detect-diagnose-fix cycle within configured authority limits, surfacing only the decisions that require SRE judgment or production change authority.
How Does Goldfinch AI AIOps Platform Use 8 Agents to Reduce Alert Noise 80%, Cut MTTR 70%, and Prevent 40% of Outages Through Predictive Anomaly Detection and Autonomous Remediation?
The Observability Agent aggregates telemetry continuously via API Tool Call. The Anomaly Agent applies ML anomaly detection via Data Analysis. The Root Cause Agent traverses the CMDB topology via API Tool Call. The Remediation Agent executes approved fixes in Kubernetes and cloud APIs. The Change Risk Agent evaluates ServiceNow change requests before deployment windows. The Capacity Agent forecasts capacity 30 to 90 days ahead via Data Analytics. The Incident Agent manages P1/P2 incidents in ServiceNow via Integration Workflow as Tool. The IT Operations Orchestrator coordinates all 8 agents through the shared IT operations Knowledge Base.
Goldfinch AI ships with 9 native out-of-the-box agent tools. Users can add custom tools self-service beyond the 9 native tools. Gartner: 2.1 million alerts per month, less than 0.1% requiring immediate action. This Goldfinch AI AIOps platform reduces that noise to the actionable signal – and acts on it autonomously.
Watch Demo
| Video Title: |
Goldfinch AI AIOps Platform | 8 Agents; Anomaly Detection to Autonomous Remediation and P1 Incident Management in ServiceNow |
|---|---|
| Duration: |
7 to 10 minutes |
Outcome & Benefits
| Autonomy: |
80% of actionable alerts handled autonomously through the full detect-diagnose-remediate cycle; P1 and P2 incidents managed end-to-end by the Incident Agent with SRE notification and HITL for production-critical actions; autonomous remediation STP rate: 72%+ for standard remediation playbook action types (service restart; pod scaling; cache flush; connection pool reset) |
|---|---|
| Time Saved: |
MTTD (Mean Time to Detect) from 45 minutes average (monitoring tool alert lag + SRE triage) to under 3 minutes (continuous ML anomaly detection); MTTR from 4.2 hours industry average (IDC) to under 74 minutes (autonomous root cause + remediation); change risk assessment from 2 to 4 hours manual CAB research to automated scoring within minutes of change request submission |
| Cost Reduction: |
80% reduction in alert noise (Gartner 2.1M alerts/month; 80% reduction = 1.68M fewer alerts requiring SRE triage time); IDC: $250,000 per hour average outage cost; 40% outage prevention from proactive capacity and anomaly management = $2.4M to $24M annually depending on outage frequency and duration; 30 to 40% SRE capacity reallocation from reactive triage to proactive engineering |
| Reliability: |
100% of P1 and P2 incidents managed through structured ServiceNow workflow with full timeline documentation; 40% reduction in outage frequency from predictive capacity and anomaly management; MTTR reduced 70% from autonomous root cause and remediation execution; change-related incident rate reduced 35%+ from Change Risk Agent pre-deployment risk scoring |
Performance Metrics
| KPI | Before | After | Impact |
|---|---|---|---|
| Alert Noise | 2.1M alerts/month (Gartner) | 80% noise reduction | 420K actionable alerts from 2.1M |
| MTTD | 45 minutes average | Under 3 minutes | 93%+ faster detection |
| MTTR | 4.2 hours (IDC industry average) | Under 74 minutes | 70% faster resolution |
| Outage Prevention | Reactive only | 40% of outages prevented | Proactive operations shift |
| SRE Triage Capacity | 60-70% of working hours | Under 20% of working hours | 40-50% capacity reallocation |
| Autonomous Remediation | 0% (all manual) | 72%+ STP rate | New capability |
Technical Details
| Evaluation Metrics: |
MTTD (Mean Time to Detect: time from anomaly onset to Anomaly Agent alert publication); MTTR (Mean Time to Resolve: time from P1/P2 incident creation to ServiceNow resolution); alert noise reduction rate (% of raw monitoring alerts classified as non-actionable by Anomaly Agent vs. baseline); autonomous remediation STP rate (% of Remediation Agent actions executed without SRE HITL); change-related incident rate (P1/P2 incidents attributed to changes as % of total changes implemented); capacity threshold breach prevention rate (% of projected capacity breaches prevented through proactive Capacity Agent action); Root Cause Agent accuracy (% of RCA findings confirmed as correct cause by post-incident review). |
|---|---|
| Auditability: |
Every agent action is logged with: agent name, triggered event (ServiceNow incident ID, Dynatrace/Datadog alert ID, or CMDB change ID), tool invoked, API target system and endpoint, action executed (or held for HITL), confidence score, HITL status (autonomous execution or SRE Lead/CAB-reviewed), system confirmation (Kubernetes pod restart confirmation, ServiceNow incident ID, cloud API response code), and timestamp., The IT Operations Orchestrator maintains a per-incident audit trail from anomaly detection through root cause identification, remediation execution, and incident resolution. ITSM audit trail: all P1 and P2 incidents include complete agent action chronology for post-incident review and SLA reporting. Change governance audit trail: all Change Risk Agent assessments stored with risk score, dependency impact analysis, and recommendation for CAB review documentation. SRE teams access the full audit trail via the Goldfinch AI audit dashboard; CIO receives the weekly AIOps health digest. |
| Tool Router: |
P1 anomaly event activates Incident Agent simultaneously with Root Cause and Remediation Agents; ServiceNow change request activates Change Risk Agent; weekly schedule activates Capacity Agent. Each Worker Agent selects its tools based on task type: API Tool Call for monitoring platform and ITSM reads and writes; Data Analysis for ML scoring and forecasting; Knowledge Base for operational context and runbook retrieval; Document Intelligence for incident document and change document analysis; Integration Workflow as Tool for ITSM sub-workflows; Data Analytics for operational dashboards., The IT Operations Orchestrator routes each operational event to the appropriate Worker Agent based on event type and severity – anomaly signal above P2 threshold activates Root Cause Agent immediately; Root Cause Agent finding with Tier 1 playbook match activates Remediation Agent autonomously; Root Cause Agent finding with Tier 2 or above playbook match routes to SRE Lead for HITL approval before Remediation Agent acts; |
| Scheduling: |
IT Operations Orchestrator monitors all configured event streams via Watcher Tools continuously (immediate trigger on any P1 alert event; 60-second polling for P2/P3 anomaly signals; 5-minute polling for capacity threshold alerts); Observability Agent runs continuous telemetry aggregation (polling at 30-second intervals for real-time metrics, 60-second for logs); Anomaly Agent runs continuous ML scoring on the normalized telemetry stream (anomaly detection within 90 seconds of signal deviation onset); Root Cause Agent activates immediately on Anomaly Agent P1/P2 event publication;, Remediation Agent activates immediately on Root Cause Agent finding publication for Tier 1 autonomous actions; Change Risk Agent runs on each new ServiceNow change request submission and 24 hours before each approved change window; Capacity Agent runs weekly forecast computation and immediately on any service approaching 80% utilization threshold; Incident Agent activates immediately on P1/P2 incident creation and manages lifecycle until resolution. |
| Planner Type: |
Event-driven goal decomposition with LLM-hybrid analysis – the IT Operations Orchestrator uses schema-driven rules for incident severity classification (P1/P2/P3/P4 thresholds), remediation authorization tiers (Tier 1 autonomous: pod restart, cache flush; Tier 2 HITL: database restart, auto-scaling group modification; Tier 3 restricted: production namespace deletion, data-bearing service termination), and change risk escalation (High/Critical → CAB); LLM reasoning governs root cause topology analysis narrative, change risk assessment context, capacity forecast recommendation generation, and post-incident review synthesis. |
| Agent Roles: |
Anomaly Agent: Data Analysis (ML-based anomaly detection on normalized telemetry stream – statistical deviation scoring for latency, error rate, throughput, CPU/memory utilization), Knowledge Base Vector Search (known anomaly signatures and historical anomaly precedents per service); Root Cause Agent: API Tool Call (ServiceNow CMDB https://docs.servicenow.com/en-US/bundle/washingtondc-it-service-management/ topology graph query), Document Intelligence (incident post-mortems and vendor advisories for known failure pattern analysis), Data Analysis (causal chain topology traversal scoring and confidence computation), Knowledge Base Vector Search (known failure patterns, root cause precedents for current service topology), Capacity Agent: API Tool Call (Snowflake DW https://docs.snowflake.com/ utilization data query, cloud capacity APIs for reserved instance and auto-scaling policy management), Data Analysis (utilization trend forecasting: 30/60/90-day projections with confidence intervals), Data Analytics with Charts/Graphs/Dashboards (capacity forecast dashboard with threshold breach projection dates), Knowledge Base Vector Search (capacity planning benchmarks and SLA thresholds per service), Incident Agent: API Tool Call (ServiceNow incident and notification APIs, PagerDuty on-call routing), Integration Workflow as Tool (ServiceNow P1/P2 incident creation and resolver group assignment, stakeholder communication sub-workflow, post-incident review documentation sub-workflow), Data Analytics with Charts/Graphs/Dashboards (incident management dashboard: MTTR trend, resolver group performance, repeat incident rate), Knowledge Base Vector Search (resolver group assignment matrix, communication templates per incident severity), IT Operations Orchestrator (Coordinator): continuous event correlation, incident severity classification, remediation authorization routing, AIOps health dashboard assembly, SRE/CIO escalation packaging; Observability Agent: API Tool Call (Dynatrace metrics API https://docs.dynatrace.com/docs/dynatrace-api or Datadog metrics API https://docs.datadoghq.com/api/latest/, AWS CloudWatch https://docs.aws.amazon.com/cloudwatch/, Azure Monitor https://docs.microsoft.com/azure/azure-monitor/, GCP Cloud Monitoring, Kubernetes API metrics), Knowledge Base Vector Search (service telemetry baselines and SLA thresholds), Remediation Agent: API Tool Call (Kubernetes API for pod restart and scaling https://kubernetes.io/docs/reference/kubernetes-api/, AWS Auto Scaling API https://docs.aws.amazon.com/autoscaling/, Azure REST API https://docs.microsoft.com/rest/api/azure/, cloud cache APIs), Knowledge Base Vector Search (runbook procedures per service tier and action type), Integration Workflow as Tool (Kubernetes scaling sub-workflow, cloud resource adjustment sub-workflow); Change Risk Agent: API Tool Call (ServiceNow Change Management API, CMDB dependency query for impact analysis), Document Intelligence (proposed change documentation analysis for completeness and risk signals), Data Analysis (change risk scoring: dependency blast radius, historical change-to-incident correlation, change window timing risk), Knowledge Base Vector Search (change risk rubrics, historical change-to-incident patterns) |
Connectivity and Deployment
| Supported Protocols: |
REST API (Dynatrace API v2; Datadog API; ServiceNow REST API; Kubernetes API; AWS CloudWatch and Auto Scaling APIs; Azure Monitor and Resource Manager REST APIs; GCP Cloud Monitoring API; PagerDuty REST API; Snowflake DW JDBC); Webhook (Dynatrace and Datadog alert webhook receivers for real-time event streaming); SMTP (SRE and stakeholder incident notifications; CIO AIOps health digest); HTTPS; OAuth 2.0; IPSec Tunnel (on-premises ServiceNow; Dynatrace managed; and monitoring infrastructure connectivity) |
|---|---|
| Security & Compliance: |
SOC Type II certified; GDPR-compliant operational data handling (infrastructure telemetry and incident data processed under GDPR Article 6 legitimate interest for IT service management; data minimization applied; telemetry retention configurable per data classification); HIPAA-eligible configuration for healthcare IT operations (patient-data-adjacent system monitoring); SOX-compliant change governance audit trail (all production changes assessed and documented with Change Risk Agent scoring; CAB review status; and implementation outcome for SOX IT general controls documentation). RBAC enforced: CIO has full operations portfolio view; VP Infrastructure accesses all infrastructure domains; SRE Lead accesses their assigned service domains; Remediation Agent autonomous authority limited by configured action tier; Incident Agent communication scope limited to configured stakeholder groups. |
| Tenancy Model: |
Both single-tenant and multi-tenant deployments are supported. Single-tenant is recommended for organizations where infrastructure topology data; incident history; and operational runbooks represent sensitive operational intelligence. Multi-tenant is the default shared-cloud deployment. Both support on-premises monitoring infrastructure connectivity via IPSec Tunnel. |
| On-Premise Supported: |
Yes – eZintegrations connects to on-premises systems (ServiceNow on-prem; Dynatrace managed on-prem; on-premises monitoring infrastructure; on-premises CMDB; and others) via IPSec Tunnel. eZintegrations is a browser-based; cloud-hosted platform and does not require any on-premises installation. |
AI Credits
| Credit Consumption Model: |
Continuous low-credit monitoring (Observability Agent and Anomaly Agent) with event-triggered higher-credit cycles for Root Cause Agent and Incident Agent per detected anomaly/incident; weekly Capacity Agent forecast cycle; per-change-request Change Risk Agent assessment Estimated Credits per End-to-End Run: Per P1 incident end-to-end (detection through resolution and post-incident review): ~35 to 65 credits per P1 incident Per P2 incident: ~20 to 40 credits per P2 incident Per autonomous remediation (Tier 1 action): ~8 to 15 credits per remediation Per change risk assessment: ~10 to 20 credits per change request Weekly Capacity Agent forecast cycle: ~20 to 40 credits per weekly run Ongoing daily monitoring overhead (Observability + Anomaly continuous): ~150 to 300 credits per day |
|---|---|
| Retry / Reflection Credit Cost: |
Each Root Cause Agent reflection/retry cycle: ~5 to 8 additional credits per retry. Remediation Agent reflection pre-execution check: ~2 to 4 additional credits. At 15% complex incident rate (incidents requiring RCA reflection); add approximately 12 to 18% to the monthly credit estimate. |
| Monthly Credit Estimate (at Typical Volume): |
Mid-market IT operations (5 to 10 P1 incidents/month; 30 to 50 P2 incidents/month; 100 change requests/month): ~12,000 to 25,000 credits per month Large enterprise IT operations (20 to 40 P1 incidents/month; 100 to 200 P2 incidents/month; 500 change requests/month): ~40,000 to 80,000 credits per month Large-scale cloud-native operations (complex microservices; high incident volume; continuous deployment): ~80,000 to 150,000 credits per month |
| Pricing Model: |
Static Platform Fee + AI Credits. Platform fee covers unlimited non-LLM orchestration across all agents (monitoring platform API polling; CMDB connection management; ServiceNow webhook handling; Kubernetes API polling; SMTP notification dispatch; audit log writes). AI Credits consumed only by Goldfinch AI tool invocations and LLM reasoning cycles. |
| Credit Optimization Notes: |
Configure Anomaly Agent to apply a pre-filter threshold (anomalies below the P3 severity floor do not trigger Root Cause Agent or Knowledge Base queries – reduces Root Cause Agent credits by 40 to 60% by eliminating sub-threshold noise from the RCA pipeline). Batch Observability Agent API calls to retrieve all configured service metrics in a single API Tool Call per monitoring cycle rather than per-service sequential calls. Cache Knowledge Base runbook and failure pattern queries per service for 4 hours (runbooks and failure patterns for a given service do not change between incidents in a short window). Configure Capacity Agent weekly forecast to run on Monday morning (off-peak) to avoid competing with incident-driven agent cycles for LLM capacity. Apply Document Intelligence in the Root Cause Agent only for P1 incidents (not P2 or P3) – reduces Document Intelligence credits by 60 to 70% given that post-mortem analysis is most valuable for the highest-severity incidents. |
| AI Credits Required: |
Yes – Goldfinch AI agentic systems consume credits across all 8 agents per monitoring cycle, per anomaly detected and analyzed, per incident processed, and per reflection/retry loop. |
| LLM Steps Count: |
10 to 20 LLM-invoking steps per active incident cycle (Orchestrator event correlation and routing: 2 to 3 steps; Anomaly Agent ML scoring: 2 to 3 steps; Root Cause Agent topology analysis: 3 to 5 steps; Incident Agent incident creation and communication: 2 to 3 steps; Capacity Agent forecast generation: 2 to 3 steps; reflection/retry: 1 to 2 steps per retry) |
| Per-Agent Credit Breakdown: |
IT Operations Orchestrator: 2 to 4 credits per incident cycle (event correlation + severity classification + routing); Observability Agent: 1 to 2 credits per telemetry aggregation cycle (API Tool Call to monitoring platforms – low credit consumption as primarily data collection); Anomaly Agent: 2 to 4 credits per anomaly detection cycle (ML anomaly scoring Data Analysis + Knowledge Base baseline retrieval);Root Cause Agent: 4 to 8 credits per RCA (CMDB topology query + ca usal chain Data Analysis + Knowledge Base failure pattern retrieval + Document Intelligence incident post-mortem analysis if triggered), Remediation Agent: 2 to 4 credits per remediation action (runbook Knowledge Base retrieval + API Tool Call execution confirmation); Change Risk Agent: 3 to 6 credits per change request (CMDB impact Data Analysis + Document Intelligence change documentation + Knowledge Base risk rubric retrieval); Capacity Agent: 4 to 8 credits per weekly forecast (Snowflake DW utilization query + 30/60/90-day Data Analysis forecast + Data Analytics dashboard render); Incident Agent: 3 to 6 credits per P1/P2 incident lifecycle (ServiceNow API Tool Call + communication Integration Workflow + Data Analytics incident dashboard update) |
FAQ
1. What is the Agentic IT Operations Center (AIOps) and what does it automate end to end?
The Goldfinch AI AIOps platform from eZintegrations deploys 8 coordinated AI agents - an IT Operations Orchestrator and 7 Worker Agents - to continuously aggregate observability signals from Dynatrace or Datadog (Observability Agent), detect anomalies via ML (Anomaly Agent), perform topology-aware root cause analysis through the CMDB (Root Cause Agent), execute autonomous remediation in Kubernetes and cloud APIs (Remediation Agent), assess change risk before production deployments (Change Risk Agent), forecast infrastructure capacity 30 to 90 days ahead (Capacity Agent), and manage P1/P2 incidents end-to-end in ServiceNow (Incident Agent). Gartner: IT organizations receive 2.1 million alerts per month; less than 0.1% require immediate action - this system reduces that noise by 80% and acts autonomously on the actionable signal.
2. How does the multi-agent architecture work?
The IT Operations Orchestrator continuously receives events from all 7 Worker Agents and coordinates the operational response - when the Anomaly Agent detects a P1 anomaly, the Orchestrator simultaneously activates the Root Cause Agent (to identify the causal chain in the CMDB topology) and the Incident Agent (to create the ServiceNow record and notify the resolver group) while the Remediation Agent prepares the remediation action. All agents share a persistent IT operations Knowledge Base containing CMDB topology maps, known failure patterns, runbook procedures, and historical incident data - ensuring each agent's decisions are grounded in the affected service's known behavior and the organization's operational context.
3. Which Goldfinch AI tools does this system use?
The system uses 7 of Goldfinch AI's 9 native tools: Watcher Tools (IT Operations Orchestrator - continuous event stream monitoring), API Tool Call (all 7 Worker Agents - Dynatrace/Datadog, ServiceNow CMDB, Kubernetes API, AWS/Azure/GCP cloud APIs, PagerDuty, Snowflake DW), Data Analysis (Anomaly Agent ML scoring; Root Cause Agent topology analysis; Change Risk Agent impact scoring; Capacity Agent utilization forecasting), Knowledge Base Vector Search (all 8 agents - CMDB topology, failure patterns, runbooks, change risk rubrics), Document Intelligence (Root Cause Agent incident post-mortems; Change Risk Agent change documentation), Data Analytics (Capacity Agent forecast dashboard; Incident Agent incident dashboard; Orchestrator AIOps health dashboard), and Integration Workflow as Tool (Incident Agent ServiceNow sub-workflows; Remediation Agent execution sub-workflows). Users can add New Relic, AppDynamics, Splunk, CloudHealth, and custom runbook automation platforms self-service.
4. How does the system ensure data accuracy and handle errors?
The Root Cause Agent applies a reflection cycle when topology traversal confidence falls below 0.75 - re-querying the Knowledge Base for known failure patterns, expanding CMDB scope to 2nd-degree dependencies, and retrying up to 3 times before SRE Lead escalation with the best available context. The Remediation Agent applies a reflection check before any action - confirming the proposed action matches a Knowledge Base runbook and no conflicting change is in progress. All Tier 2 and above remediation actions (database restarts, auto-scaling group modifications) require SRE Lead HITL approval before execution. P1 incidents trigger immediate VP Infrastructure notification regardless of agent confidence score.
5. What types of data and documents does this system process?
The system processes: real-time metrics, logs, and distributed traces from Dynatrace or Datadog (Observability Agent); CMDB topology and dependency graphs from ServiceNow CMDB (Root Cause Agent); incident post-mortems and vendor advisory documents (Root Cause Agent Document Intelligence); proposed change documentation including change request forms, test evidence, and rollback plans (Change Risk Agent Document Intelligence); historical utilization data from Snowflake DW (Capacity Agent); and ServiceNow incident and change records across the full ITSM lifecycle.
6. Who uses this system and in which departments?
Daily operators include SRE Leads (receive Root Cause Agent RCA findings, Tier 2+ remediation HITL requests, and Incident Agent P1/P2 coordination), IT Operations Directors (monitor the AIOps health dashboard and review Change Risk Agent assessments for the Change Advisory Board), and DevOps teams (receive Change Risk Agent pre-deployment risk scores). The CIO and VP Infrastructure receive the weekly AIOps operations digest and immediate P1 incident escalations. The Change Advisory Board receives Change Risk Agent automated risk assessments for all submitted change requests.
7. How does the safety layer and human oversight work?
HITL triggers when: Remediation Agent identifies a Tier 2+ action (database restart, auto-scaling group modification, Kubernetes namespace changes) - SRE Lead approval required; P1 incident affecting revenue-generating systems - VP Infrastructure or CIO notification within 5 minutes; Change Risk Agent scores High or Critical - CAB review required before change proceeds; Root Cause Agent confidence below 0.75. After 3 retries, the SRE Lead is escalated with full incident context. The Remediation Agent never executes Tier 2 or above actions without documented SRE approval. All HITL decisions logged with reviewer identity, authorized action, and timestamp for ITSM audit trail and SOX IT general controls documentation.
8. What are the key business benefits and executive KPIs improved?
Key executive KPIs improved include: MTTD from 45 minutes to under 3 minutes (93%+ faster detection), MTTR from 4.2 hours (IDC industry average) to under 74 minutes (70% reduction), alert noise from 2.1 million monthly alerts (Gartner) to 80% noise reduction, 40% outage prevention from predictive capacity and anomaly management (IDC: $250,000 per hour average outage cost), autonomous remediation STP rate of 72%+ for standard action types, change-related incident rate reduced 35%+ from pre-deployment risk scoring, and SRE triage capacity reallocation from 60 to 70% of working hours to under 20% - freeing 40 to 50% of SRE capacity for proactive engineering and reliability improvement.
Resources
| Blog: |
Agentic AI for Humanoid Robots: The Integration Layer Powering Next-Gen Autonomous Systems |
|---|---|
| Platform Overview: |
eZintegrations Platform – Enterprise iPaaS, AI Workflows & Agentic AI |
| Demo: |
Book a Demo |
| Goldfinch AI Platform: |
Agentic AI Platform — Goldfinch AI by eZintegrations |
Case Study
| Industry: |
Financial Services / Global Digital Bank |
|---|---|
| ROI: |
SLA breach penalty avoidance: €2.04M (6 incidents x €340K prior year vs. 0 in 6-month period). Capacity outage prevention: 4 capacity incidents in prior year x €340K average outage cost = €1.36M avoided (6-month period: estimated €680K proportional). Change-related incident reduction: 68% reduction x prior-year change-related incident count x €340K average = €1.12M (6-month: €560K). SRE productivity reallocation: 42 SREs x (60% – 18% = 42% time freed from alert triage) x €92,000 average fully-loaded SRE cost = €1.62M annually (6-month: €810K). CAB efficiency: 12 → 2.4 hours/week x 52 weeks x €85/hour blended CAB member cost = €44,000 annually (6-month: €22K). Total 6-month |
| Problem: |
MTTD: average 38 minutes from anomaly onset to SRE awareness (monitoring lag + alert queue depth + triage time); MTTR: average 3.8 hours for P1 incidents; 6 P1 incidents in the prior year had exceeded 4 hours, each triggering SLA breach penalties averaging €340,000 per incident; Change-related incidents: 28% of P1/P2 incidents in the prior year were attributed to production changes – the Change Advisory Board process was consuming 12 CAB member-hours per week reviewing change requests manually; Capacity incidents: 4 capacity-related outages in the prior year (2 database connection pool exhaustion events, 2 API gateway throughput ceiling events) – all of which showed 6 to 8 weeks of detectable utilization trend before the outage., A global digital bank with 14 million active customers, 280 microservices, and a 99.99% SLA commitment operated its IT operations function with a team of 42 SREs and 18 IT Operations Analysts. Monitoring stack: Dynatrace for APM and infrastructure, 3 separate cloud providers (AWS primary, Azure secondary, GCP for ML workloads), ServiceNow for ITSM. Key operational problems: Alert volume: 2.3 million alerts per month from Dynatrace and cloud monitoring – SREs estimated they were responding to 18,000 to 22,000 alerts per month that required investigation, of which 94% were either false positives or resolved without action; |
| Solution: |
Deployed the eZintegrations Goldfinch AI AIOps platform in 16 business days across all 280 microservices and all 3 cloud providers. IT Operations Orchestrator configured for the bank’s P1/P2/P3/P4 incident severity classification and 99.99% SLA commitment parameters. Observability Agent connected to Dynatrace API v2 (280 services, all APM and infrastructure metrics) + AWS CloudWatch + Azure Monitor + GCP Cloud Monitoring via API Tool Call. Anomaly Agent configured with ML anomaly detection baselines per service (3 months of telemetry history ingested into Snowflake DW for initial baseline computation)., Root Cause Agent connected to ServiceNow CMDB (280 microservices, full topology and dependency graph including 840 inter-service dependencies). Remediation Agent configured with 3-tier authorization: Tier 1 autonomous (pod restart, cache flush, connection pool reset) – 28 runbook actions; Tier 2 SRE HITL (database restart, Kubernetes deployment rollback, auto-scaling group modification) – 14 runbook actions;, Tier 3 restricted (service termination, data-bearing pod deletion) – CISO and VP Infrastructure approval required. Change Risk Agent connected to ServiceNow Change Management API (all change requests routed through automated risk scoring before CAB review). Capacity Agent connected to Snowflake DW (12 months utilization history per service, 30/60/90-day forecasting enabled for all 280 services). Incident Agent configured for ServiceNow P1/P2 incident creation, PagerDuty on-call routing (12 resolver groups), and stakeholder communication templates per incident severity. Knowledge Base Vector Search loaded with: 840 CMDB service dependency relationships, 127 known failure patterns from 3 years of post-incident reviews, 42 Tier 1 and Tier 2 remediation runbooks, change risk scoring rubrics calibrated against 2 years of change-to-incident correlation data, and capacity planning thresholds for all 280 services. |
| Outcome: |
After 6 months: Alert volume requiring SRE investigation from 18,000 to 22,000 per month to 3,200 per month (82% noise reduction). MTTD from 38 minutes to 2.4 minutes average. MTTR from 3.8 hours to 68 minutes average (82% reduction). P1 incidents: 6 in prior year (pre-deployment) to 2 in the 6-month period – 1 was resolved autonomously in 41 minutes (Tier 1 remediation: connection pool reset); 1 required SRE HITL (Tier 2: database restart) and resolved in 58 minutes. SLA breach penalties: 6 x €340,000 in prior year (€2.04M) to 0 in the 6-month period., Change-related incident rate: from 28% of P1/P2 incidents to 9% (68% reduction) – Change Risk Agent automated scoring reduced CAB manual review time from 12 to 2.4 member-hours per week. Capacity incidents: 0 in 6 months – Capacity Agent identified and resolved 7 capacity threshold approaches (4 database connection pool limits, 2 API gateway throughput ceilings, 1 Kubernetes node utilization) proactively 4 to 11 weeks before the projected threshold breach. |
Related products
-
How to Automate 2-Way Verification Between Purchase Orders and Invoices
 $0.00
Download
$0.00
Download
-
Vendor Onboarding Agent
 $0.00
Download
$0.00
Download
-
How to Automate Enterprise M&A Due Diligence Using Multi-Agent AI Systems
 $150.00
Download
$150.00
Download
-
How to Automate Employee Lifecycle Management Using Multi-Agent AI Systems
 $150.00
Download
$150.00
Download
