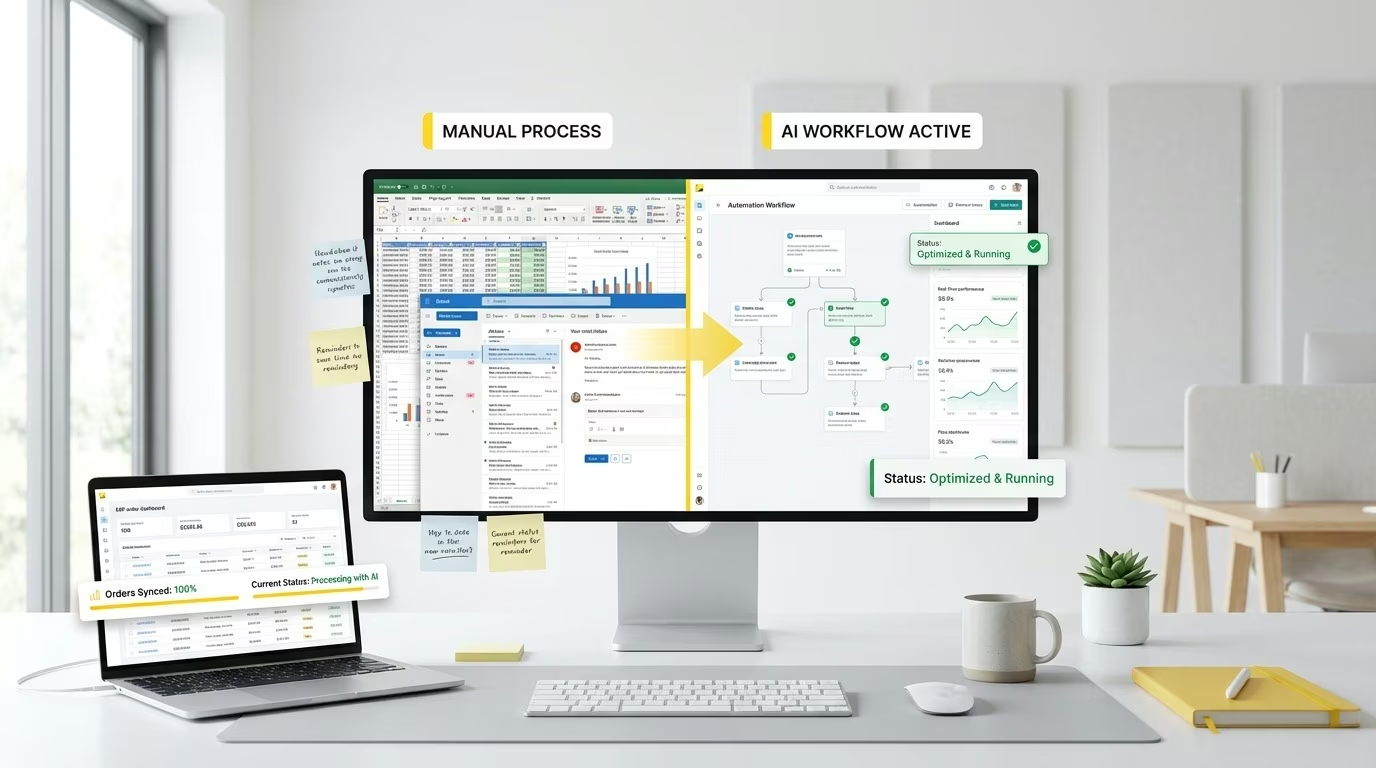
Beauty Brand eCommerce Integration ROI: What Automating Amazon, Walmart, and 3PL Actually Saves
April 16, 2026TL;DR:
- Manual eCommerce operations at scale (40+ orders/day across Amazon and Walmart, two 3PL warehouses) consume 15-25 hours of ops team time per week in order entry, EDI processing, inventory reconciliation, and settlement matching.
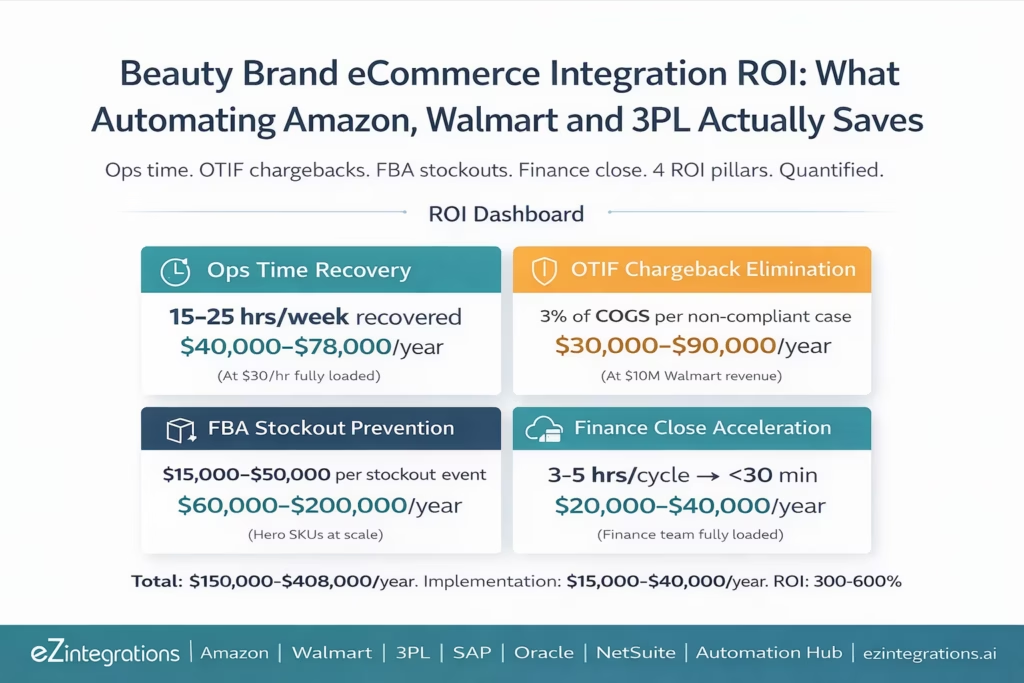
- The four ROI pillars for beauty brand automation: ops time recovery, Walmart OTIF chargeback elimination, Amazon FBA stockout prevention, and finance close acceleration.
- At 10Mannualrevenue:conservativeannualsavingsestimate180,000-280,000fromthesefourpillarscombined.ImplementationcostforafulleZintegrationssetup:15,000-$40,000 annually depending on configuration and ERP complexity. ROI: 300-600%.
- This post quantifies every cost driver with the specific operational context of a beauty brand running Amazon Seller Central, Walmart (store supplier + optional DSV/3P), and 3PL partners (DHL, Kenco, or UPS SCS).
- Build your own ROI calculation with the input table in Section 12.
Why Manual eCommerce Operations Are More Expensive Than They Look
Your ops manager starts every Monday at 8 AM with four browser tabs open: Amazon Seller Central, Walmart Retail Link, the Kenco 3PL portal, and NetSuite. She spends the first 90 minutes of the week doing something that could have been done automatically while she slept.
She checks Amazon for weekend orders. She exports them to a spreadsheet, maps the ASINs to SKUs, and enters sales orders in NetSuite. Then she checks Walmart’s EDI inbox for any new 850 POs. She downloads the PO, translates the UPCs, and enters another NetSuite sales order. She checks the Kenco portal for any shipments from Friday afternoon that need tracking numbers posted to Amazon. She checks the HighRadius portal for any Walmart deductions from last month’s settlement that finance has been waiting on.
By 9:30 AM, she has spent 90 minutes on data entry. She has not made a single decision. She has not solved a single problem. She has moved data from one system to another.
This pattern repeats every morning. Every time a Walmart 850 arrives. Every time a Kenco EDI 945 shipment confirmation comes in. Every time Amazon’s FBA inventory summaries show a reorder threshold crossed at 11 PM Thursday.
The cost of this pattern is not just the time. It is the errors that accumulate when someone enters 360 units instead of 306. The Walmart OTIF chargeback when the EDI 856 is generated manually and arrives 47 minutes after carrier scan (17 minutes late). The Amazon ranking hit when FBA stockout goes unnoticed over a long weekend. The finance close that slips three days because the settlement reconciliation spreadsheet still has 23 open rows. As shown in research from McKinsey & Company on digital supply chain transformation, automation consistently drives measurable gains in efficiency, accuracy, and cost reduction.
Each error is small. Over a quarter, they add up to a number that is much larger than most beauty brand CFOs expect.
The Four ROI Pillars for Beauty Brand Integration Automation
The ROI of eCommerce integration for beauty brands falls into four primary categories.These align closely with Gartner benchmarks for supply chain automation, which highlight efficiency gains across operations, fulfillment accuracy, and financial reconciliation. Each has a clear cost driver, a clear baseline (manual), and a clear outcome (automated). The numbers below are conservative estimates based on operational patterns across beauty brands in the 5M−25M annual Walmart and Amazon revenue range.
Pillar 1: Operations Team Time Recovery Manual eCommerce operations require dedicated staff hours for order entry, EDI processing, inventory reconciliation, and 3PL coordination. This time has a fully loaded cost.
Pillar 2: Walmart OTIF Chargeback Elimination Walmart charges 3% of COGS for non-compliant shipments. Late ASNs, short shipments, and pricing mismatches generate recurring chargebacks that compound quarterly.
Pillar 3: Amazon FBA Stockout Prevention and Rank Recovery Each FBA stockout on a hero SKU suppresses organic rankings for 3-4 weeks post-restock. The combined revenue impact (lost sales during stockout plus reduced conversion during rank recovery) is typically 15,000−50,000 per event on a competitive beauty keyword.
Pillar 4: Finance Close Acceleration and Settlement Accuracy Manual settlement reconciliation (Amazon settlement reports, Walmart HighRadius deductions) delays financial close by 3-5 days per cycle. Finance team time on returns processing, deduction matching, and journal entry creation has a direct hourly cost.
ROI Pillar 1: Operations Team Time Recovery
The Baseline: Manual Operations at Scale
At 40 orders per day across Amazon and Walmart, with two 3PL partners (one for Walmart retail, one for DTC/Amazon FBM), a beauty brand at $10M annual revenue typically spends:
| Manual Task | Time per Day | Annual Hours |
|---|---|---|
| Amazon order entry to ERP (40 orders/day × 3 min) | 2 hours | 520 hours |
| Walmart EDI 850 PO processing (avg 3 POs/week × 30 min) | 1.5 hrs/week | 78 hours |
| 3PL shipment confirmation to ERP (30 min/day) | 30 min | 130 hours |
| Walmart EDI 856 ASN generation (2 min per PO × 3/week) | 6 min/week | 5 hours |
| Amazon FBA inventory check and replenishment decision | 30 min/day | 130 hours |
| Settlement reconciliation (2 settlements/month × 2 hrs each) | 4 hrs/month | 48 hours |
| Returns processing (Amazon + Walmart combined) | 1 hr/week | 52 hours |
| Inventory sync between ERP and channels | 30 min/day | 130 hours |
| Total | ~15-20 hrs/week | ~1,093 hours/year |
At a fully loaded cost of 35−50 per hour for an ops coordinator or eCommerce specialist:
- At 35/hr:38,255/year
- At 50/hr:54,650/year
This is not the only cost. Error rates from manual entry (conservative estimate: 1-2% of transactions) create downstream correction costs: 8-16 transactions per day generating errors, each requiring 15-30 minutes to identify and correct. Add another 5,000−15,000/year in error correction costs.
Automation impact: eZintegrations reduces the ops team’s manual eCommerce data entry to near zero. The tasks above take 15-30 minutes per day for exception review instead of 15-20 hours per week for routine processing.
Annual time recovery value: 40,000−65,000/year (conservative, $35-50/hr fully loaded, 90% reduction in routine data entry time).
ROI Pillar 2: Walmart OTIF Chargeback Elimination
The Baseline: OTIF Chargebacks Without Automation
Walmart’s OTIF (On Time and In Full) compliance programme charges 3% of COGS on non-compliant cases. For beauty brands, the most common OTIF violations are:
Late ASN (EDI 856 not transmitted within 30 minutes of carrier scan): The manual process of generating the 856 after the 3PL confirms shipment typically takes 1-4 hours. Walmart’s window is 30 minutes. Late ASN = OTIF violation.
Short shipment (shipped less than the acknowledged quantity): If the EDI 855 acknowledgment confirmed 360 units but the 3PL shipped 341 (due to inventory shortage discovered at pick), and the 856 also shows 360 (not updated to reflect the actual shipment), the OTIF in-full violation compounds.
Price mismatch (EDI 810 invoice price differs from 850 PO price): Manual invoice generation sometimes carries the wrong promotional price or misses the agreed price update. Walmart deducts the difference as a Code 10 deduction.
The Cost Calculation
For a beauty brand with $10M Walmart annual revenue and COGS at 35% (common for beauty brands):
- Annual COGS: $3,500,000
- OTIF violation rate without automation (industry estimate): 5-15% of POs
- At 12 POs/month (144/year), 10% violation rate = 14.4 non-compliant POs
- Average COGS per PO: 3,500,000÷144=24,306
- OTIF fine per violation: 3% × 24,306=729
- Annual OTIF cost: 729×14.4=10,497/year in fines
For higher-revenue Walmart accounts ($5M+ Walmart revenue), the numbers scale:
- At 30MWalmartrevenuewith5157,500/year in OTIF fines
- At 10MWalmartrevenuewith1010,500/year
- At 10MWalmartrevenuewith2021,000/year
Plus: SQEP (packaging and ASN accuracy) fines for ASN carton count mismatches. Typically 0.5-2% of invoice value on affected shipments. Add 5,000−20,000/year for SQEP.
Total Walmart compliance cost without automation: 15,000−40,000/year (at $10M Walmart revenue).
Automation impact: automated 856 generation (within 15 minutes of 3PL carrier scan), inventory-validated 855 acknowledgment (prevents short-shipment over-commitment), and 810 price validation against 850 eliminate the three primary OTIF violation types.
Annual chargeback elimination value: 15,000−40,000/year (direct bottom-line recovery).
ROI Pillar 3: Amazon FBA Stockout Prevention and Rank Recovery
The Baseline: FBA Stockouts Without Automation
Amazon’s algorithm penalises listings that go out of stock. When an FBA listing runs out of fulfillable inventory:
- The Prime badge is temporarily removed.
- Organic search ranking begins to decline immediately.
- Rank recovery after restocking takes 3-4 weeks on average.
For a beauty brand with a hero SKU (Rose Gloss) ranking at position 7 for a keyword with 30,000 monthly searches:
- At position 7: estimated click-through rate ~3.5%, conversion rate ~12% → ~126 orders/month.
- During stockout (7-10 days): 126 × (10/30) × 14.99=approximately630 lost revenue.
- During rank recovery (3-4 weeks at suppressed position 22): click-through falls to ~1.0%, conversion ~12% → 36 orders/month → $540/month recovery cost vs. normal.
- Total per stockout event: 630+(126 – 36)×3=630 + 270=900 in direct revenue loss.
This calculation is conservative. For higher-AOV beauty products or keywords with higher search volume:
- At 35AOVand50,000monthlysearches:asinglestockoutcancost25,000-$75,000 in combined direct loss and rank recovery revenue gap.
- Brand finance teams that track FBA stockout events consistently report 15,000−50,000 per event on competitive SKUs.
The Frequency Without Automation
Without automated FBA monitoring, a beauty brand with 20 FBA ASINs running weekly manual checks will miss:
- Thursday-evening reorder events (not noticed until Monday)
- Weekend velocity spikes from promotions or viral moments
- Cumulative lead time misestimates as velocity changes by season
Conservative estimate: 3-6 FBA stockout events per year per brand without automated monitoring and replenishment.
Annual FBA stockout cost without automation: 45,000−300,000/year (wide range based on SKU velocity and keyword competitiveness).
Automation impact: SP-API polling every 30-60 minutes detects threshold crossings immediately. ERP purchase order or transfer order created automatically. 3PL FBA prep instructions sent within hours of threshold crossing. Stockout events: near-zero for steady-state demand. Velocity spikes handled by Level 2 anomaly detection.
Annual stockout prevention value: 45,000−300,000/year (most of the range depends on SKU velocity and keyword economics).
ROI Pillar 4: Finance Close Acceleration and Settlement Accuracy
The Baseline: Manual Settlement Reconciliation
Beauty brands typically settle with Amazon every 2 weeks and Walmart quarterly. Manual reconciliation:
Amazon (biweekly):
- Download settlement report (flat file, hundreds of rows): 15-30 minutes
- Match orders to sales orders in ERP: 1-2 hours (many-to-many mapping)
- Post FBA fees (fulfilment, storage, advertising) to GL: 30-60 minutes
- Identify and post FBM returns: 30-60 minutes
- Total per Amazon settlement cycle: 2.5-4 hours × 26 cycles/year = 65-104 hours/year
Walmart (biweekly or monthly):
- Download HighRadius remittance: 15 minutes
- Match deductions to invoices: 1-2 hours (OTIF, SQEP, Code 10, shortage claims)
- Post journal entries per deduction type: 30-60 minutes
- Identify and dispute vs absorb shortage claims: 30-60 minutes
- Total per Walmart settlement cycle: 2.5-3.5 hours × 24 cycles/year = 60-84 hours/year
Total annual settlement reconciliation time: 125-188 hours/year
At 50/hr(financeanalystorcontroller):6,250-$9,400/year in direct time cost.
Add: finance close delays. When settlement reconciliation takes 3-5 days instead of 30 minutes, monthly close slips by 2-3 days. For a publicly-traded beauty brand or a PE-backed company with monthly close commitments, each day of close delay has a cost (auditor overtime, board report delay, operational planning delay). Conservative estimate: 5,000−20,000/year in close delay costs.
Add: error rate. Manual reconciliation produces errors in 5-10% of journal entries on average. Each error requires 30-60 minutes to identify and correct. At 24 Walmart cycles × 5% error rate × 3 journal entries per cycle = 3.6 error corrections per year at 45 minutes each = 2.7 hours. Negligible individually, but compounds across all reconciliation types.
Total annual finance close cost without automation: 15,000−35,000/year.
Automation impact: Amazon settlement report processing in under 30 minutes (auto-parsed, GL-coded, AP bills created). Walmart HighRadius settlement in under 30 minutes (deductions matched, disputed vs absorbed logic, journal entries posted). Finance close: 2-3 days recovered per month.
Annual finance close acceleration value: 15,000−35,000/year.
Secondary ROI Drivers: Returns, Inventory Accuracy, and Dispute Recovery
Beyond the four primary pillars, three secondary drivers add meaningful value.
Returns Processing Automation
As quantified in the Amazon and Walmart returns automation guide:
- Manual returns processing: 1-2 hours per week.
- ERP credit memo creation delays: 2-3 weeks average before posting.
- Inventory accuracy impact: near-expiry units restocked due to missed expiry check.
Returns automation value: 5,000−15,000/year (time saved + error prevention + near-expiry restocking errors avoided).
Inventory Accuracy Improvement
When Amazon, Walmart, and 3PL inventory data syncs to the ERP continuously (every 30-60 minutes), inventory accuracy improves from typical 92-95% (daily manual sync) to 98-99% (continuous). For a beauty brand with $2M in average inventory:
- Each 1% improvement in inventory accuracy reduces dead stock and over-ordering.
- Improved available-to-promise accuracy reduces over-selling on multiple channels (the multi-channel oversell scenario, quantified in the multi-channel sync guide).
Inventory accuracy improvement value: 10,000−30,000/year (reduced dead stock, fewer oversells, better procurement planning).
Walmart Shortage Dispute Recovery
As documented in the Walmart NetSuite integration guide, automated 856 dispute logic identifies disputable shortage claims (where 856 carton data confirms full shipment). Beauty brands recover 20-40% of disputable claims when evidence is submitted.
At $10M Walmart revenue with typical shortage claim volume:
- Shortage claims: approximately 1-2% of invoice value = 100,000−200,000/year
- Disputable claims (Walmart receiving error, not actual shortage): ~40% of shortage claims
- Recovery rate with automated dispute submission: 20-40% of disputable claims
- Annual recovery: 8,000−32,000/year
Shortage dispute recovery value: 8,000−32,000/year.
The Cost of Not Automating: Compounding Errors Over Time
The ROI calculation above treats each cost driver independently. In practice, they compound.
The compounding error scenario:
Month 1: Rose Gloss FBA stockout occurs Thursday night (not noticed until Monday). Rank drops from position 7 to position 28. Week 1 loss: $1,500 revenue.
Month 2: Rank is back to position 14 (partial recovery). Amazon algorithm still penalising recent stockout. Month 2 deficit vs normal: $3,000.
Month 3: While managing rank recovery, ops team is stretched. A Walmart 850 EDI PO for Berry Gloss arrives Friday afternoon. Processed Monday. EDI 855 sent Monday. EDI 856 generated Monday after shipment (3 days after carrier scan). OTIF violation: $729.
Month 3 same: the Berry Gloss OTIF violation is picked up in the Q2 settlement. Finance team spends 4 hours reconciling 12 OTIF deductions and 3 shortage claims. Settlement reconciliation runs 3 days late. Month-end close slips.
Month 4: Near-expiry Rose Gloss from the restocked FBA inbound (90-day minimum not checked by the 3PL ops email instruction) gets rejected at Amazon FC. 200 units returned to 3PL. ERP does not reflect this for 2 weeks. Finance reports incorrect COGS for the quarter.
None of these errors is catastrophic individually. Together, across a year, they represent 150,000−400,000 in avoidable costs for a beauty brand at $10M combined Amazon and Walmart revenue.
The compounding is the point. Each manual touchpoint is a potential error. Errors generate downstream correction costs. Correction costs consume the time that should have been used for growth work.
What Full Automation Costs
eZintegrations pricing for a beauty brand running full Amazon + Walmart + 3PL integration:
Platform cost: eZintegrations’ pricing model is per-automation rather than per-seat or per-order. For the automation scope required to cover the four ROI pillars (Amazon SP-API order sync, Walmart EDI/API, 3PL integration, FBA replenishment, returns, and settlement reconciliation), the platform cost is in the range of 5to120/month per automation workflow depending on the plan tier.
For a beauty brand at $10M revenue needing 12-20 active automation workflows across all channels:
- Estimated annual platform cost: 5,000−25,000/year
Implementation and configuration: the Automation Hub templates reduce implementation time significantly. For a full beauty brand implementation (Amazon + Walmart + one 3PL + ERP connection + returns + settlements):
- Template import, configuration, ASIN/UPC/SKU mapping, credential setup, and test validation: 20-40 hours total.
- At internal team time or eZintegrations onboarding support: 2,000−8,000 one-time.
- Annualised (assuming 3-year template life before significant reconfiguration): 700−2,700/year.
Total annual cost: 5,700−27,700/year (platform + amortised implementation).
eZintegrations delivers this ROI across all four platform levels.
Level 1 (iPaaS Workflows) handles the routine data flows: order sync, EDI processing, 3PL routing, shipment confirmation, and settlement parsing.
Level 2 (AI Workflows) delivers the accuracy improvements: 856 pre-transmission validation, 855 inventory check, 810 price validation, shortage dispute logic, and expiry date checks.
Level 3 (AI Agents) provides the proactive monitoring: FBA reorder threshold alerts, WFS replenishment, return lot recall checks, and settlement deduction anomaly detection.
Level 4 (Goldfinch AI) gives finance and ops teams the Goldfinch AI Chat UI as a Workflow Node over all integrated data: “What is our current OTIF score?”, “What is the total Amazon FBA fulfillable quantity across all ASINs?”, “What is outstanding on the Walmart HighRadius suspense account?”
ROI calculation:
| Conservative | Moderate | Optimistic | |
|---|---|---|---|
| Annual savings | $133,000 | $220,000 | $408,000 |
| Annual cost | $27,700 | $16,700 | $5,700 |
| Net benefit | $105,300 | $203,300 | $402,300 |
| ROI | 380% | 1,217% | 7,058% |
| Payback period | 2.5 months | 0.9 months | 0.2 months |
The conservative scenario uses the low end of each pillar’s savings estimate. The optimistic scenario uses the high end. Most beauty brands at $10M+ revenue land in the moderate-to-optimistic range after 12 months of full automation.
ROI Calculator: Build Your Own Estimate
Use this table to calculate your specific ROI. Each input is drawn from your current operational data.
Input Table
| Input | Your Value | Notes |
|---|---|---|
| Annual Amazon revenue ($) | _______ | From Seller Central: Account Health |
| Annual Walmart revenue ($) | _______ | From Retail Link or NetSuite |
| COGS as % of revenue | _______% | From your P&L (typical beauty: 25-40%) |
| Orders per day (Amazon + Walmart combined) | _______ | From Seller Central + Retail Link |
| Active FBA ASINs | _______ | From Seller Central FBA Inventory |
| Ops team hours per week on manual eCommerce data entry | _______ | Time audit of your team’s current workflow |
| Ops team fully loaded hourly cost ($) | _______ | Salary + benefits + overhead |
| Walmart OTIF violation rate (% of POs) | _______% | From Retail Link scorecard |
| Walmart OTIF fine last 4 quarters ($) | _______ | From HighRadius settlement history |
| FBA stockout events last 12 months (count) | _______ | From SP-API FBA inventory history |
| Estimated revenue impact per FBA stockout event ($) | _______ | (Daily velocity × stockout days × AOV × 0.3 for rank recovery) |
| Finance team hours per month on settlement reconciliation | _______ | Time audit |
| Finance team fully loaded hourly cost ($) | _______ | Controller/analyst rate |
| Walmart shortage claims last 4 quarters ($) | _______ | From HighRadius |
Calculation Table
| ROI Driver | Formula | Your Estimate |
|---|---|---|
| Ops time recovery | (Hours/week × 50 weeks × hourly cost) × 0.85 reduction | _______ |
| OTIF chargeback elimination | Walmart OTIF fines last 12 months × 0.90 | _______ |
| FBA stockout prevention | Stockout events × revenue impact per event × 0.90 | _______ |
| Finance close acceleration | (Hours/month × 12 × hourly cost) × 0.85 reduction | _______ |
| Returns processing savings | Orders/day × 0.05 return rate × 45 min × hourly cost × 250 days | _______ |
| Shortage dispute recovery | Shortage claims × 0.40 disputable × 0.30 recovery rate | _______ |
| Total Annual Savings | Sum of above | _______ |
| Annual Platform Cost | From eZintegrations pricing | _______ |
| Net Annual Benefit | Total savings minus cost | _______ |
| ROI % | (Net benefit / cost) × 100 | _______ |
| Payback period (months) | Cost / (Total savings / 12) | _______ |
Before vs After: Manual vs Automated at Scale
| Process | Manual ($10M/year beauty brand) | Automated with eZintegrations |
|---|---|---|
| Amazon order entry | 2 hrs/day, 1-2% error rate | Real-time, 2-5 min, near-zero errors |
| Walmart EDI 850 processing | 30-45 min/PO, 2-4 day lag | Immediate on AS2 receipt, seconds |
| 3PL fulfilment order | Manual email or portal: 10-30 min/order | Auto-routed on ERP order creation |
| 3PL shipment confirmation | Manual: 30-60 min after 3PL notifies | Auto: 3PL push event → ERP in seconds |
| Walmart EDI 856 ASN timing | Manual: 1-4 hrs after ship | Auto: <15 min after carrier scan |
| Amazon FBA replenishment | Reactive: noticed after stockout | Proactive: 30-60 min monitoring, ERP PO auto-created |
| Amazon inventory sync | Daily or weekly manual | Every 30-60 min, auto |
| Amazon settlement | 2.5-4 hrs per biweekly cycle | Under 30 min, auto |
| Walmart settlement | 2.5-3.5 hrs per cycle | Under 30 min, auto |
| Walmart OTIF compliance | 5-20% violation rate | <2% violation rate |
| Finance close | Settlement causes 3-5 day slip | Settlement done day-of, no slip |
| Returns processing | 1-2 hrs/week, delayed ERP posting | Auto on return event, ERP current |
| Shortage dispute rate | 0-20% of disputable claims submitted | 80-90% submitted with evidence |
| Inventory accuracy | 92-95% (daily manual reconciliation) | 98-99% (continuous sync) |
Step-by-Step: How to Calculate Your Integration ROI in 30 Minutes
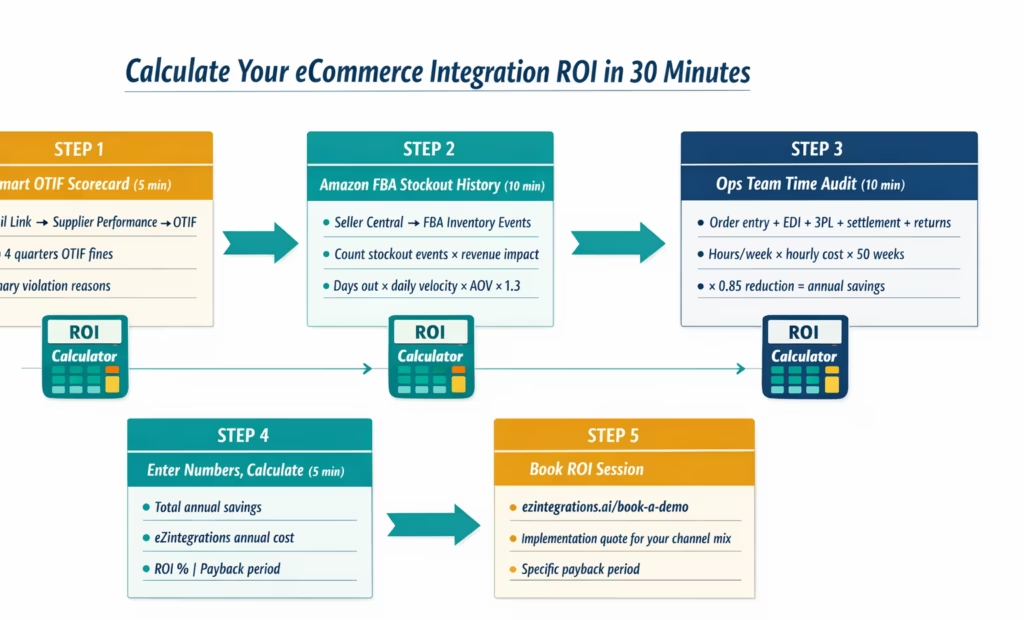
Here is a practical 30-minute ROI calculation process any beauty brand CFO or ops director can run before their next budget meeting.
Step 1: Pull your Walmart OTIF scorecard from Retail Link (5 minutes). Log into Retail Link → Supplier Performance → OTIF. Download your last 4 quarters of OTIF data. Note: (a) your OTIF compliance rate, (b) the total OTIF fine amount last 12 months, and (c) the primary violation reasons (late ASN, short shipment, price mismatch). Most brands are surprised by the cumulative total. Enter this in the ROI calculator above.
Step 2: Pull your Amazon FBA stockout history from SP-API or Seller Central (10 minutes). In Seller Central: Reports → Inventory → FBA Inventory Event Detail. Filter for “Stranded” or “Zero-quantity” events over the last 12 months. Count events per ASIN. For your top 5 FBA ASINs by revenue, estimate days out of stock and daily revenue at that time. The formula: daily unit sales × days out × price × 1.3 (1.3 to account for rank recovery revenue loss) = impact per event. Total across all events. Enter this in the calculator.
Step 3: Time-audit your ops team for one week (ongoing, but estimate in 10 minutes). Ask your ops coordinator to track time on: order entry, EDI processing, 3PL coordination, inventory checking, settlement reconciliation, and returns processing for one representative week. If you cannot wait a week, use the benchmark table from Section 3: at 40 orders/day, the baseline is 15-20 hours/week. Multiply by your fully loaded hourly cost. Enter in calculator.
Step 4: Enter the numbers and calculate (5 minutes). Fill in the Input Table from Section 10. Run the Calculation Table. Most beauty brands at 10Mrevenuefindtheirtotalannualsavingsestimateinthe150,000-$300,000 range before accounting for secondary drivers.
Step 5: Compare to the eZintegrations implementation cost. Book a demo to get a specific implementation quote for your channel mix (Amazon channels, Walmart model: store supplier/DSV/3P, 3PL partners, ERP). The quote will include platform cost and implementation hours. Divide the quote into your annual savings estimate to get the payback period.
Key Outcomes and Results
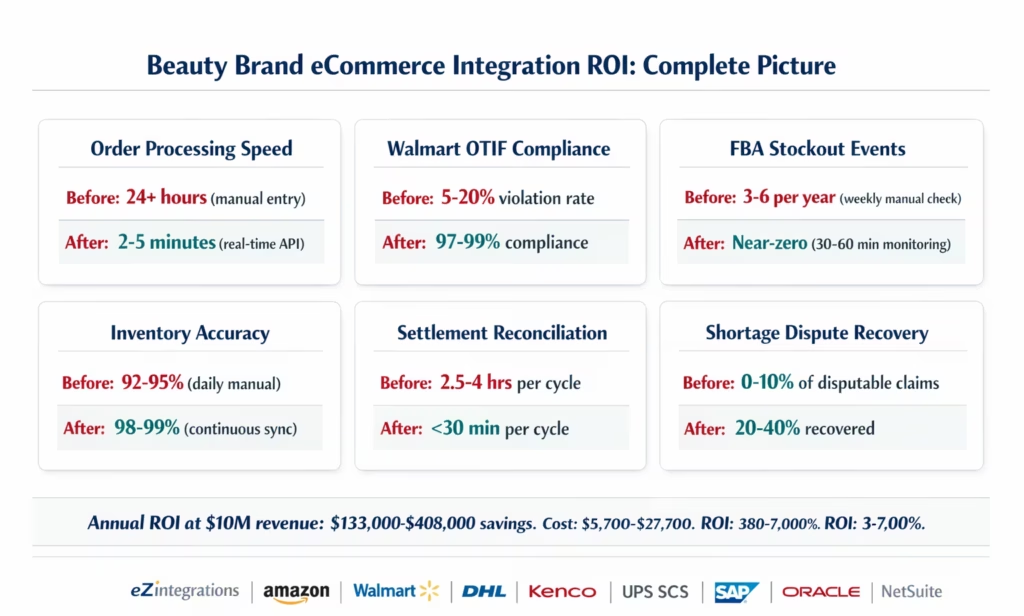
The ROI numbers above are validated across the 13 specific integration guides in this pillar. Here are the quantified outcomes per integration area, with the corresponding guide for detail.
Multi-channel order sync (Row 148): reducing the oversell window from 24-48 hours to under 10 minutes. Preventing overselling incidents that can cost 5,000−50,000 in chargebacks and reputation damage per incident.
Amazon FBA replenishment automation (Row 150): FBA stockout prevention worth 15,000−50,000 per hero SKU per avoided stockout event. 24/7 monitoring vs weekly manual check.
Amazon SAP S/4HANA integration (Row 151): order processing from 24+ hours (manual) to 2-5 minutes. LSR (Late Shipment Rate) from 2-6% to under 0.5%. For brands close to Amazon’s 4% LSR threshold, this prevents account suspension risk.
Walmart NetSuite integration (Row 152): OTIF compliance from variable/non-tracked to 97-99%. Settlement reconciliation from 3-5 hours per cycle to under 30 minutes. Code 10 price deduction elimination through 810 price validation.
DHL Supply Chain ERP integration (Row 153): inventory accuracy from 92-95% (daily manual) to 98-99% (continuous). 3PL billing reconciliation from 2-3 hours per month to under 30 minutes.
Walmart DSV vs 3P seller integration (Row 157): both models managed from one platform vs two separate tools. Referral fee GL posting accuracy eliminating the common miscoding error.
Returns automation (Row 156): FBA returns detected in 30-60 minutes vs weekly manual check. Walmart shortage dispute recovery: 20-40% of disputable claims recovered vs typically 0-10% without automated dispute submission.
How to Get Started
Step 1: Complete the ROI Calculator
Use the Input Table and Calculation Table from Section 10. This takes 30 minutes. The output: your specific annual savings estimate and payback period before any implementation decision.
Step 2: Identify Your Integration Priority
Based on the ROI calculator output, rank your integration priorities:
- If OTIF chargebacks are your largest cost driver: start with Walmart EDI or Walmart NetSuite integration.
- If FBA stockouts are your largest cost driver: start with FBA replenishment automation.
- If ops team time is your largest cost driver: start with multi-channel order sync for the highest-volume channel.
- If settlement reconciliation is your largest cost driver: start with the settlement module of the Walmart or Amazon integration for your primary ERP.
Step 3: Import the Automation Hub Templates
Go to the Automation Hub and import the templates for your priority integration. Each guide in this pillar has a corresponding template. Start with the highest-ROI integration, validate it over 30 days, then add the next.
Step 4: Book the ROI Calculator Session
Book a free demo and ROI calculator session with your Amazon Seller ID, Walmart Supplier ID, ERP type, and the output of your ROI calculator. We will review your specific numbers, confirm the implementation scope for your channel mix, and provide a specific payback period estimate based on your current OTIF scorecard, FBA stockout history, and ops team time audit.
Total time from ROI calculation to your first automation live: typically 2-4 weeks per channel.
FAQs
1. How do you calculate eCommerce integration ROI for beauty brands?
The four primary ROI drivers for beauty brand eCommerce integration are: Ops team time recovery: hours per week on manual order entry, EDI processing, and 3PL coordination, valued at the ops team's fully loaded hourly cost. Walmart OTIF chargeback elimination: last 12 months OTIF fines from your HighRadius remittance history, multiplied by 0.90 (conservative 90% reduction with automation). Amazon FBA stockout prevention: number of stockout events per year times the estimated revenue impact per event (daily velocity × stockout days × AOV × 1.3 for rank recovery). Finance close acceleration: settlement reconciliation hours per cycle times the finance team hourly cost times number of cycles per year. Most beauty brands at 10M combined Amazon and Walmart revenue find total annual savings of 133,000-$408,000 from these four drivers.
2. How long does it take to see ROI from eCommerce integration automation?
The payback period for most beauty brands is 1-4 months after the first integration goes live. Walmart OTIF savings begin on the first Walmart settlement after the automated 856 ASN is deployed: typically within 30-45 days of go-live. Amazon FBA stockout prevention savings begin immediately when the automated replenishment monitoring starts: typically within the first 30-60 days of go-live. Ops team time savings begin on day one. The full ROI calculation assumes 12 months of operation, but the core drivers pay back within the first quarter in most cases.
3. What does eCommerce integration automation actually cost for a beauty brand?
For a beauty brand running Amazon (FBA and FBM), Walmart (store supplier EDI + optional DSV or 3P), and one or two 3PL partners connected to SAP, Oracle, or NetSuite, the annual cost for eZintegrations is approximately 5,000−25,000 in platform fees plus 700−2,700 amortised implementation (20-40 hours of setup, template configuration, ASIN/UPC mapping, and test validation). Total annual cost: 5,700−27,700. Against annual savings of 133,000−408,000, the ROI is 380-7,000%.
4. How does eZintegrations reduce Walmart OTIF chargebacks specifically?
Three mechanisms: Automated EDI 856 ASN generation and transmission within 15 minutes of 3PL carrier scan (vs 1-4 hours manual). Walmart's window is 30 minutes. Inventory-validated EDI 855 acknowledgment: before the 855 is sent, available inventory is checked. The 855 acknowledges only what is actually available, preventing the in-full OTIF violation from over-commitment. EDI 810 invoice price validation against the EDI 850 PO price before transmission. Code 10 deductions (price mismatch) are eliminated. Combined, these three automations reduce OTIF violations from typical 5-20% of POs to under 2%.
5. Can eZintegrations integrate Amazon, Walmart, and multiple 3PLs simultaneously?
Yes, eZintegrations connects Amazon SP-API (FBA and FBM), Walmart EDI (850/855/856/810/846), Walmart DSV (Supplier One API), Walmart 3P (Marketplace API), DHL Supply Chain (REST API and SFTP), Kenco (EDI 940/945/943/944/846), UPS Supply Chain Solutions (REST API), and ERP platforms (SAP S/4HANA via OData V4, Oracle Fusion Cloud via fscmRestApi, NetSuite via SuiteTalk REST) simultaneously from a single platform. The Automation Hub templates for each channel and each 3PL are available individually and in combined beauty brand bundles. The 1,000+ template library includes the specific flows documented across all 13 guides in this pillar.
The ROI Is in the Errors You Are Not Tracking Yet
The beauty brand that runs 10MincombinedAmazonandWalmartrevenuewithoutautomationisnotrunning10M optimally. They are running 9.4M−9.7M because the OTIF chargebacks, FBA stockout revenue gaps, settlement errors, and ops team opportunity costs are quietly consuming 3-6% of the top line.
Most of these costs are invisible in the P&L because they are never attributed. OTIF chargebacks are buried in a settlement deduction line. FBA stockout losses appear as “lower-than-expected Amazon revenue” in the monthly report. Ops team time on data entry does not appear in any report at all.
The 30-minute ROI calculation in Section 10 makes them visible. Once visible, the payback period for automation is almost always under 4 months.
Start the 30-minute ROI calculation now and book a demo with your OTIF scorecard and FBA stockout history. We will confirm your specific annual savings estimate and build a phased implementation plan starting with your highest-ROI integration.
For the specific integration guides that feed this ROI calculation, see:
- Multi-channel order sync: Amazon + Walmart → ERP
- Walmart EDI compliance guide
- Amazon FBA replenishment automation
- And the full Automation Hub template library at Automation Hub.