Overview
The Console  in eZintegrations provides real-time visibility into the data flowing through your Integration Bridge.
It allows users to inspect live data at any stage of processing, helping verify transformations, troubleshoot issues, and ensure correct data flow.
The Console shows exactly what data is moving through the pipeline at any moment.
When to Use
Use the Console when you need to monitor, validate, or debug data during integration development.
- Verifying source data output
- Checking operation results
- Validating target payloads
- Debugging transformation issues
- Testing integration workflows
How It Works
The Console works by capturing and displaying data at selected checkpoints in the Integration Bridge.
Users enable checkpoints using valve icons placed before or after operation blocks. When activated, the Console displays live output from those points.
All displayed data is temporary and is cleared automatically when the bridge is saved.
User Interface Representation
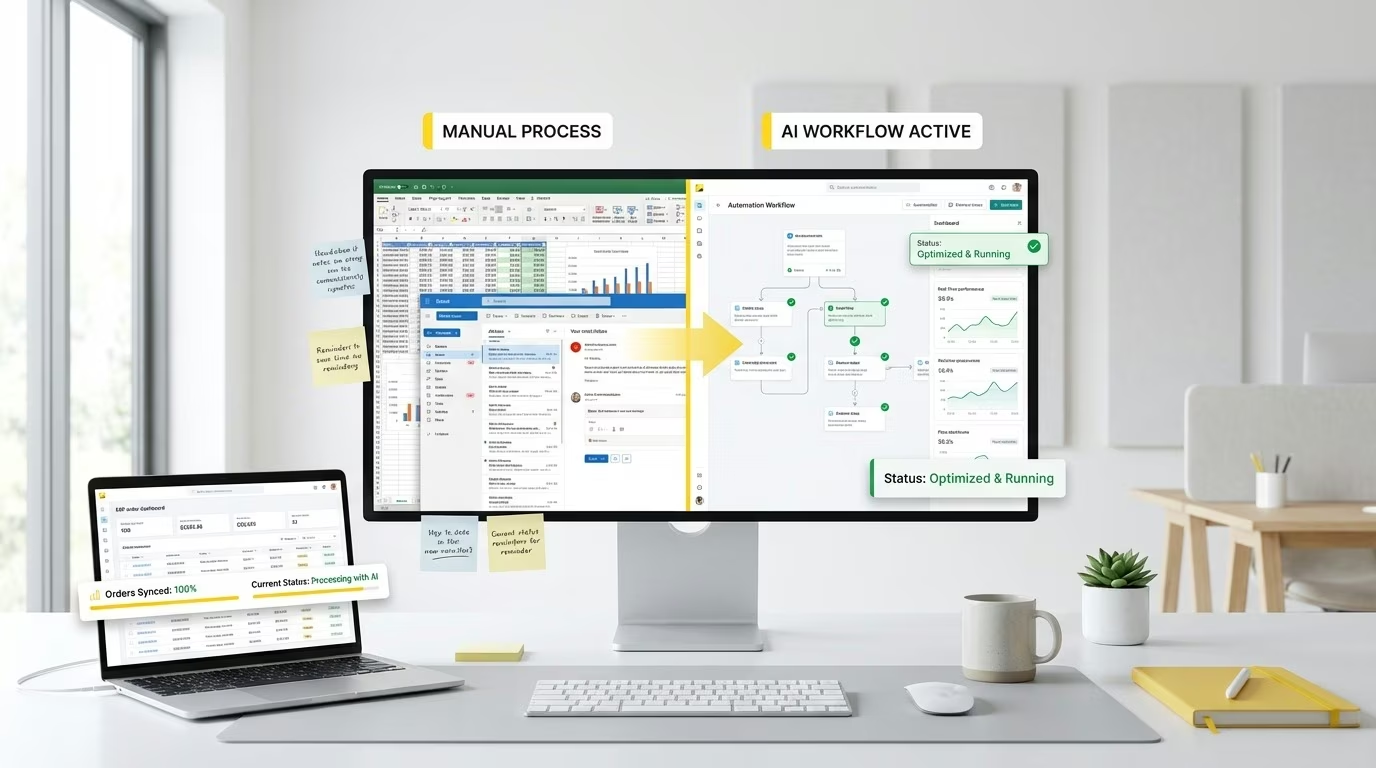
The following interface shows how the Console appears while inspecting data flow.
::contentReference[oaicite:0]{index=0}
The Console panel appears at the bottom of the screen and displays live data from selected pipeline stages.
How to Use It
Follow these steps to inspect data using the Console.
- Open the Integration Bridge.
- Go to the Data Operations section.
- Locate the valve icons before or after operation blocks.
- Click the desired valve icon.
- Open the Console bar at the bottom of the screen.
- View the output displayed for the selected checkpoint.
Once activated, the Console instantly shows data for that stage.
Information Displayed in the Console
When a valve is enabled, the Console displays detailed execution information.
- The exact data passing through the selected point
- Formatted and readable JSON with expand and collapse options
- Name of the Source, Operation, or Target
- Response status
- Time taken to receive the response
Console Controls
The Console includes built-in controls for managing logs.
- Clear: Removes all current logs
- Close: Hides the Console panel
Usage Notes
The Console is designed for live monitoring during development and testing.
- Multiple valves can be enabled simultaneously.
- Output from all active valves is displayed together.
- The Console clears automatically when the bridge is saved.
- No data is stored permanently.
- The Console is intended only for real-time inspection.
Benefits
Using the Console improves visibility and control over integration workflows.
- Enables instant data verification
- Reduces debugging time
- Improves integration accuracy
- Supports iterative development
- Enhances troubleshooting efficiency
Notes
- The Console is for development and testing purposes.
- All displayed data is temporary.
- Enable only required valves to avoid excessive logs.
- Review outputs regularly during workflow design.
- Use the Console continuously to detect issues early.
With the Console, users can click a valve, open the panel, and instantly view live data, making it easier to monitor, validate, and refine Integration Bridges.


