Real-Time Monitoring Dashboard for 24/7 Critical Alerts
November 28, 2025TL;DR
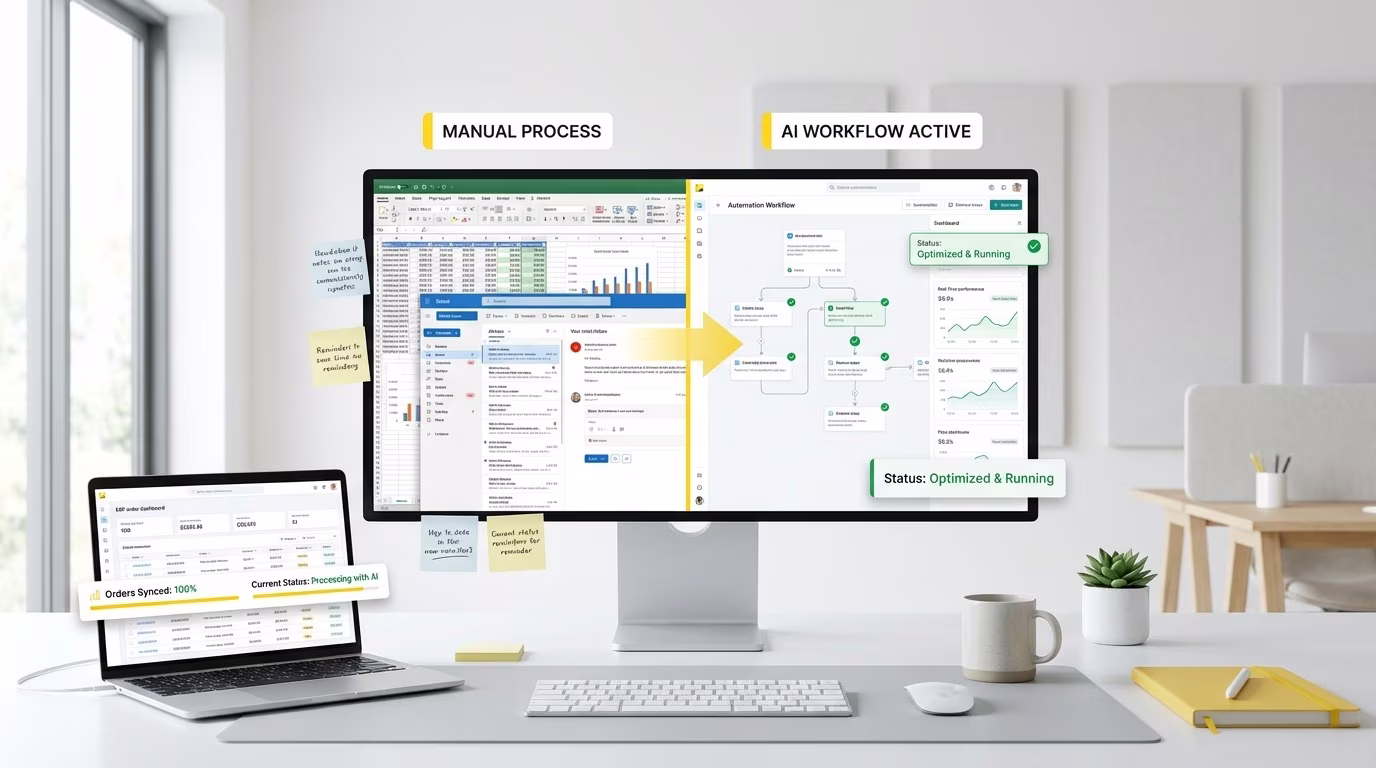
The Real-Time Monitoring Dashboard is a centralized, live view of integration activity that helps teams monitor logs, detect errors instantly, and troubleshoot issues as they happen. It aggregates logs from all Integration Bridges into a single interface with search, filters, visual summaries, charts, and a detailed log explorer.
Users access it from the main Dashboard via the Monitor tile. Logs are ingested automatically based on the configured Log Rotation Size (500 MB by default, minimum 20 MB), ensuring timely visibility even for low-volume integrations.
Key capabilities include:
- Search and filters to quickly isolate errors by operation, bridge, log level, or time range
- Visual summary cards that provide an instant snapshot of system health
- Interactive charts and heatmaps to identify trends and activity spikes
- Log Explorer for deep inspection, live tailing, and export for offline analysis
In short, the Real-Time Monitoring Dashboard reduces resolution time, improves operational visibility, and enables proactive management of integrations—making it essential for maintaining reliability and performance at scale.
Introduction – What is the Real-Time Monitoring Dashboard?
The Real-Time Monitoring Dashboard is a centralized interface that provides live visibility into integration logs, helping users monitor system activity, detect errors, and troubleshoot issues as they occur.
It aggregates logs from multiple integration bridges and presents them through visual summaries, charts, and a detailed log explorer to simplify operational monitoring and performance analysis.
Why it matters:
Centralized log monitoring can reduce mean time to resolution (MTTR) by over 30–50%, according to industry observability studies, by eliminating the need to inspect logs across multiple systems individually (Source: Elastic Observability Overview).
Accessing the Monitoring Dashboard
How do users access the Real-Time Monitoring Dashboard?
Users can access the Real-Time Monitoring Dashboard from the main Dashboard page by clicking the Monitor tile.
Once accessed, logs appear automatically based on the configured log ingestion rules.
How log ingestion works:
-
Logs are ingested according to the Log Rotation Size configured in the Advanced Settings section of the Integration Bridge Summary page.
-
If no custom value is set, logs are reflected after reaching 500 MB by default.
-
The minimum allowable Log Rotation Size is 20 MB, ensuring timely ingestion even for low-volume integrations.
Monitoring Dashboard Features
Search Bar
What does the Search Bar do?
The Search Bar enables quick keyword-based searches across selected log fields, allowing users to instantly locate relevant log entries.
How it works:
-
Supports keyword searches and exact phrase matching.
-
Searches are limited to the following columns for accuracy and performance:
-
IntegrationBridgeName
-
MESSAGE
-
level
-
Operation Name
-
Example use case:
If an operation fails intermittently, searching the operation name combined with the keyword ERROR helps isolate root causes within seconds instead of manually scanning logs.
Dropdown Filters
How do Dropdown Filters improve log analysis?
Dropdown Filters allow users to refine log data by applying structured filters across the entire dashboard.
All dashboard sections—including cards, charts, and the log explorer—update instantly when filters are applied.
Available filters:
-
Operation Name: Filter logs by specific integration operations.
-
IntegrationBridgeName: Focus on a single or multiple integration bridges.
-
Level: INFO, ERROR, WARNING, SYSTEM.
-
Date Range: Select a custom start and end timestamp.
How to use effectively:
-
Combine multiple filters (for example, ERROR + specific bridge + last 2 hours) for precise root-cause analysis.
-
Use the Clear button to reset all filters instantly.
Visual Summary Cards
What information do the Visual Summary Cards provide?
Visual Summary Cards display high-level operational metrics for the current day, giving an immediate snapshot of system health.
Visual Summary Cards Features:
- Error Count: Total logs with level = ERROR, highlighted in red for alerts.
- Total Operations: Count of distinct Operation Names executed today.
- Active Users: Number of unique users active in the last 24 hours.
- Active Bridges: Count of distinct integration bridges in use.
- Logs Ingested Today: Total number of logs ingested based on timestamp.
- Cards update in real-time with live tailing and are filterable via search or dropdowns.
Example:
If the Error Count card shows a significant number of errors, this indicates a high volume of errors requiring attention.
Charts:
Why are charts included in the dashboard?
The dashboard includes several interactive charts to visualize log patterns, distributions, and trends over time.
For data visualization best practices, see: Tableau Data Visualization Guide
Calendar Heatmap (Logs by Hours):
What does the Calendar Heatmap show?
This heatmap displays hourly log activity with color intensity representing volume.
- Grid layout showing hours (e.g., 12AM, 1AM) with counts (e.g., 166654 at 12AM).
- Darker shades indicate higher log volumes.
- Filterable by date range and levels.
- Real-time updates ensure visibility into recent activity spikes.
Log Explorer:
What is the Log Explorer used for?
The Log Explorer is a bottom-panel data table for in-depth log review, with pagination and scrolling for large datasets.
Log Explorer Features:
- Columns: timestamp, level, IntegrationBridgeName, Operation Name, UserName, MESSAGE (preview).
- MESSAGE column is expandable to view full log details.
- Supports export to CSV or Excel for offline analysis.
- Toggle between inline dashboard view and a full-page explorer mode.
- Real-time live tailing appends new logs automatically.
You can learn more about how Integration Bridges work in our detailed guide here
FAQ’s
1. What is the Real-Time Monitoring Dashboard?
The Real-Time Monitoring Dashboard provides a real-time overview of integration logs, enabling live monitoring, analysis, and troubleshooting. It aggregates data from all connected Integration Bridges and provides visual charts, summary cards, and a detailed Log Explorer for efficient debugging.
2. How do I access the Real-Time Monitoring Dashboard?
You can access the dashboard from the main Dashboard page by clicking the Monitor tile. Logs appear based on the configured Log Rotation Size defined in the Integration Bridge’s Advanced Settings. If no custom value is set, logs will reflect after reaching 500 MB, with 20 MB being the minimum allowed size.
3. What search capabilities are available in the Monitoring Dashboard?
The Search Bar supports keyword and exact phrase searches across key fields including IntegrationBridgeName, MESSAGE, level, and Operation Name. It is designed for quick filtering of relevant logs but does not search across non-key columns to maintain performance and clarity.
4. How do the dropdown filters help with log analysis?
Dropdown filters allow refinement of dashboard data by selecting specific Operation Names, IntegrationBridgeName values, log levels (INFO, ERROR, WARNING, SYSTEM), and custom date ranges. Filters can be combined for precise analysis and cleared any time for a full reset.
5. What insights do the Visual Summary Cards provide?
The dashboard’s summary cards display daily metrics such as Error Count, Total Operations, Active Users, Active Bridges, and Logs Ingested Today. These cards give immediate visibility into system health and update in real-time with incoming log data.
6. What visualization options are available for analyzing log patterns?
The dashboard includes multiple interactive charts: a Pie Chart for log-level distribution, a Donut Chart for operation breakdowns, a Line Chart to track log volume over time, and a Calendar Heatmap showing hourly activity levels. All charts support live updates, filtering, and tooltips for deeper insight.